Mineral Sample Computed Tomography Inspection
Mineral samples examination is a crucial aspect of materials science, covering a wide range of applications. It includes everything from core drilling samples on-site to powdered particles in the mineral processing stage, and metal products of the metallurgical process. By analyzing the structural morphology and elemental composition of minerals, information such as geological history, mineral value, and refining efficiency can be obtained.
Traditional methods for analyzing mineral composition include using a polarizing microscope to observe the distribution and shape of crystal lattices, which helps identify the minerals and their locations. Electron microscopes with energy dispersive spectroscopy (EDS) are also used, along with various X-ray techniques. For instance, X-ray fluorescence (XRF) can determine the elemental composition, and X-ray diffraction (XRD) can reveal the metal lattice structure and then compare characteristics with standard alloy. However, these techniques are limited to surface measurements and required specific conditions, such as high vacuum, conductive coatings, and polished surfaces, restricting their use to laboratory settings. Additionally, these methods involve sampling inspections and require multiple operations to achieve statistical accuracy.
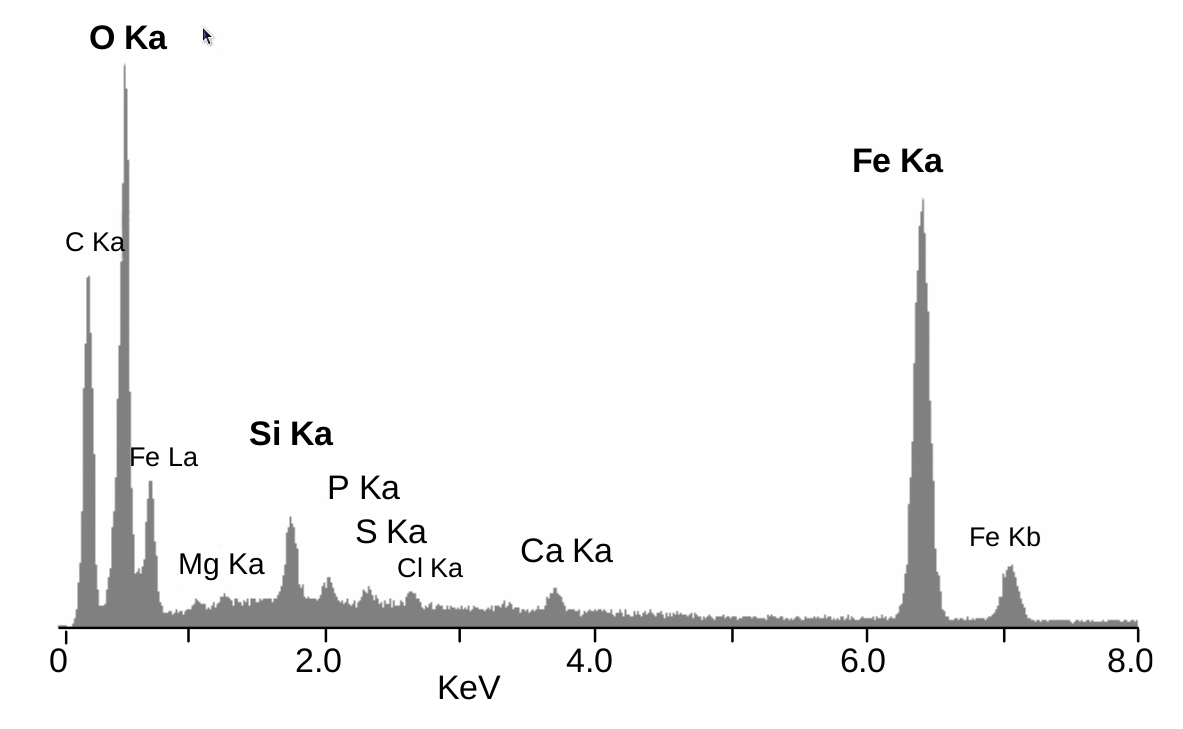
EDS/XRF measurement results.
(Source: Wikipedia: Energy-dispersive X-ray spectroscopy)
EDS/XRF measurement results.
(Source: Wikipedia: Energy-dispersive X-ray spectroscopy)
When observing structures at a certain scale, transmissive imaging technology can measure the absorption of X-rays passing through various materials and structures, producing projections on the detector. Multi-energy imaging can further separate differences in thickness and density. However, this technique is limited to penetrable flat materials with relatively simple internal structures and requires sufficiently distinct density differences. For example, bone density measurements (DXA) in medical equipment benefit from a well-regulated imaging environment, parameters, and data databases to effectively differentiate and quantify materials.
Another emerging method is using X-ray computed tomography, which not only clearly presents internal structures to calculate dimensions but also analyzes and quantifies specific materials. CT imaging provides three-dimensional structures with sampling rates that are more than a hundred times greater than traditional methods, while also avoiding the biases associated with surface sampling stereology. CT metrology is particularly suited for mineral analysis and metallurgical operations, as it quickly acquires and analyzes extensive sample information, including mineral content, particle size, porosity, and distribution. This allows for adjustments in production processes, effectively reducing production costs and increasing efficiency.
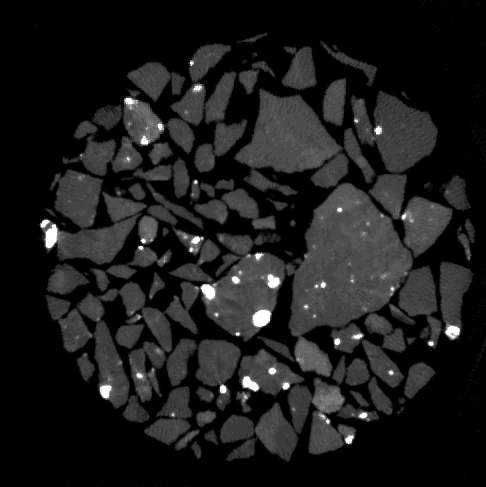
Three-dimensional and cross-sectional CT images of encapsulated mineral particles
The image below shows a serpentine sample from Hualien, Taiwan, including its visible light and X-ray image. During the geological formation of serpentine, it is usually accompanied by other olivine minerals, such as pyroxene and magnetite, which have varying commercial values. Analysis of the distribution and proportions of different minerals is required, allowing for adjustments in mineral processing procedures and parameters. (Special thanks to Professor Chen Hui-fen from the National Taiwan Ocean University, for providing the sample.)
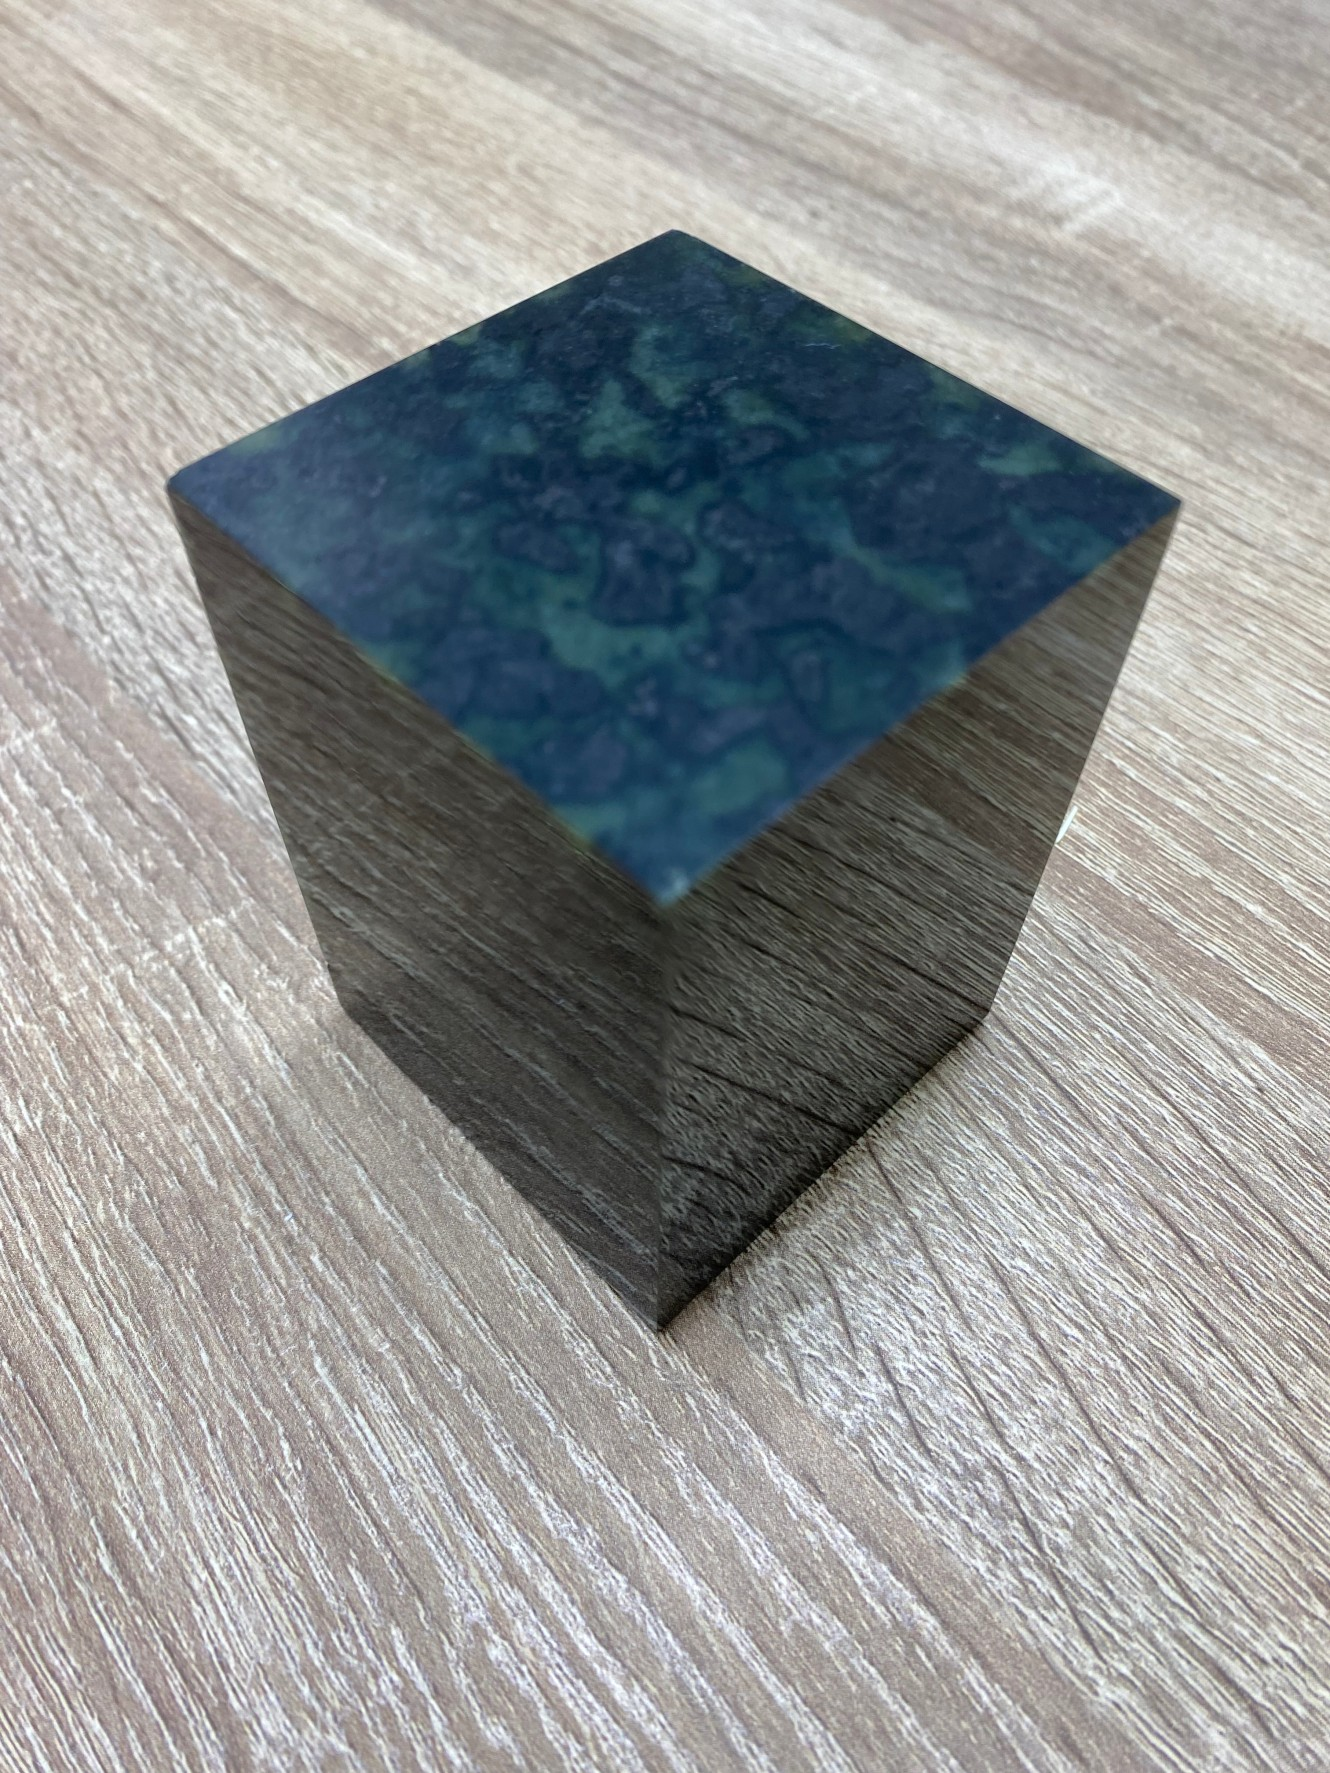
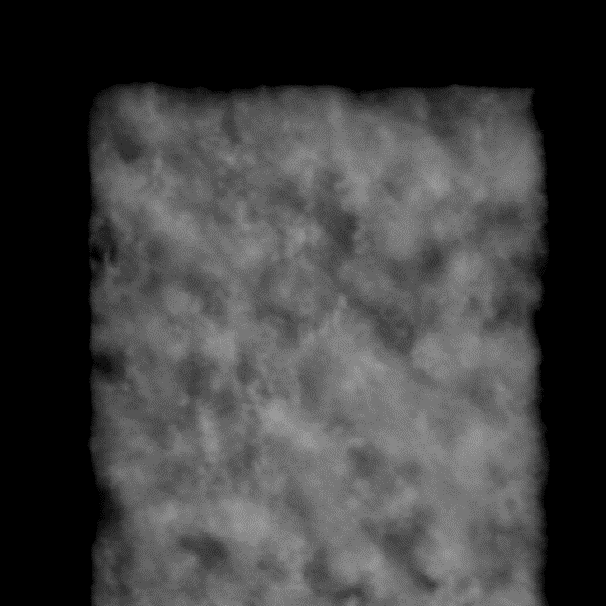
Visible light image and X-ray projection image of serpentine sample
The X-ray image reveals that the mineral sample contains structures of at least two different density minerals, forming a foggy projection. According to observations from sliced microscope images, the sample contains olivine and serpentine, with trace amounts of magnetite. Microscope images show that the magnetite grain size is around tens of micrometers, which affects the processing method of the serpentine minerals in that area. Hence, magnetite is the primary target for analysis in this sample. Therefore, a CT scan and reconstruction were arranged to locate and quantify the magnetite within the sample.
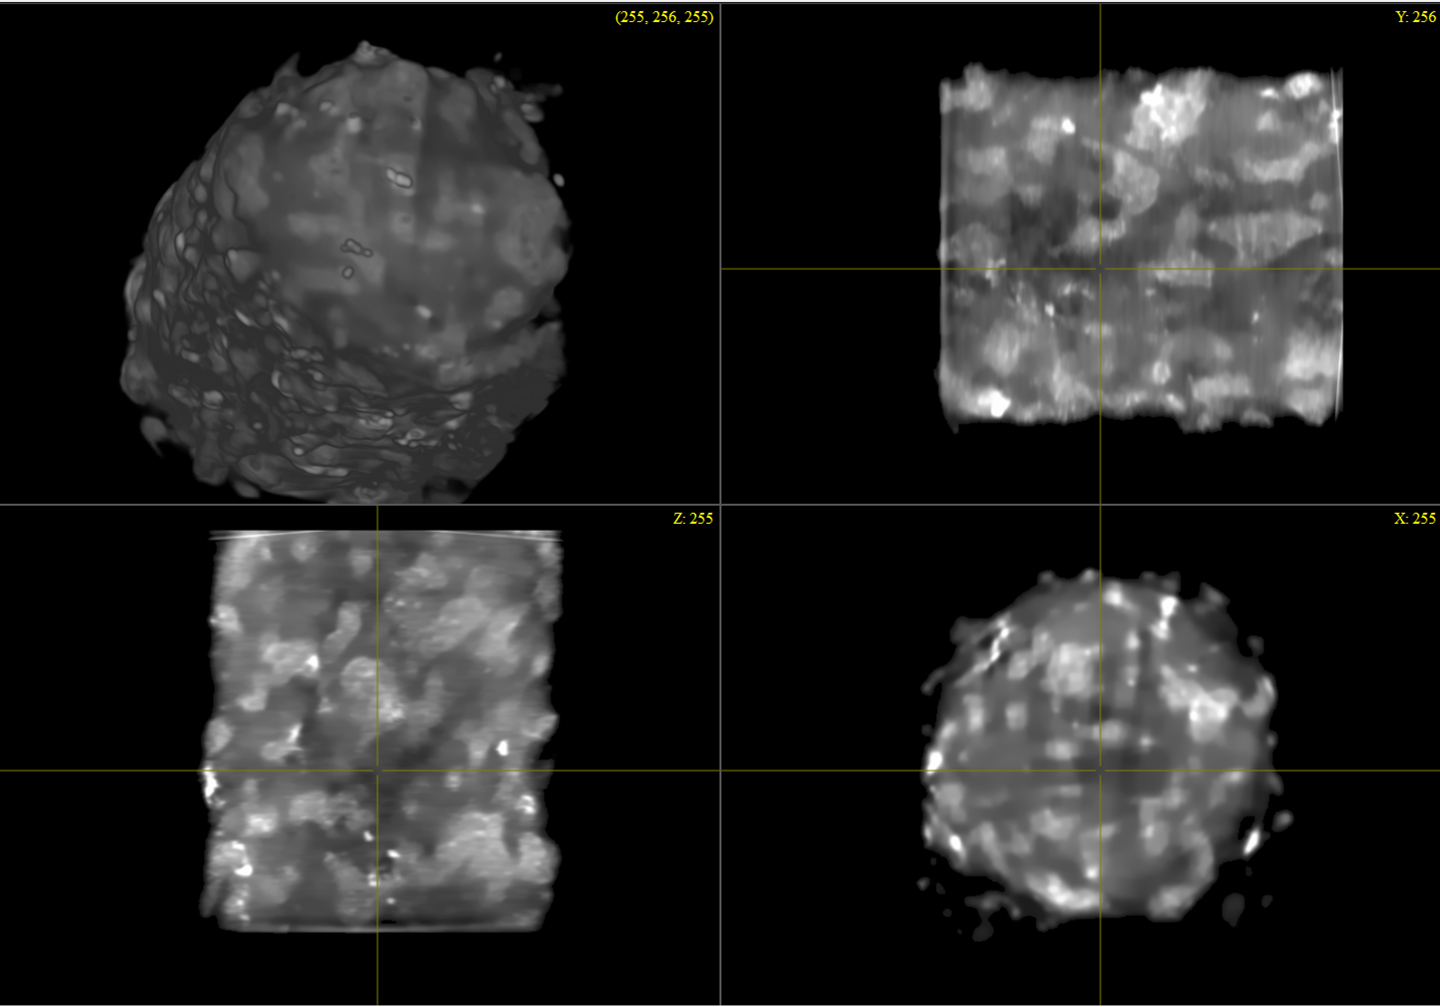
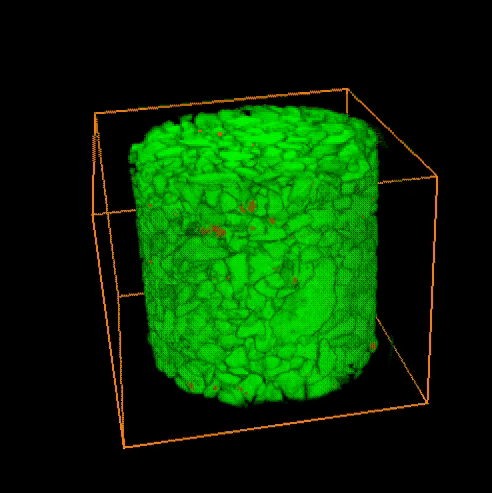
Volume image of the sample and cross-sectional images along different axes
Through the reconstructed three-dimensional images, the internal structure of the sample can be observed. According to basic mineral data, olivine has the composition (Mg,Fe)2SiO4 with a specific gravity of approximately 3.3 g/cm³; serpentine has the composition(Mg,Fe)3Si2O5(OH)4 with a specific gravity of approximately 2.4 g/cm³; and magnetite has the composition Fe2+Fe3+2O4 with a specific gravity of approximately 5.17 g/cm³. Based on this information, it can be inferred from the CT images that the brighter areas represent olivine, the darker areas represent serpentine, and the bright spots within the internal structure are magnetite. The images suggest that the magnetite grain size should be no less than one hundred micrometers and is evenly distributed. It is also noted that stereological error may occur due to the position of the slices.
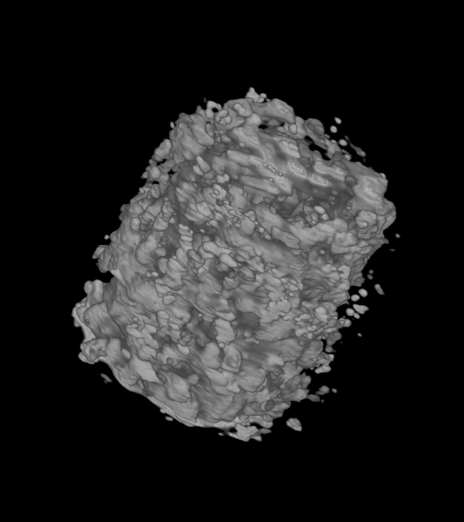
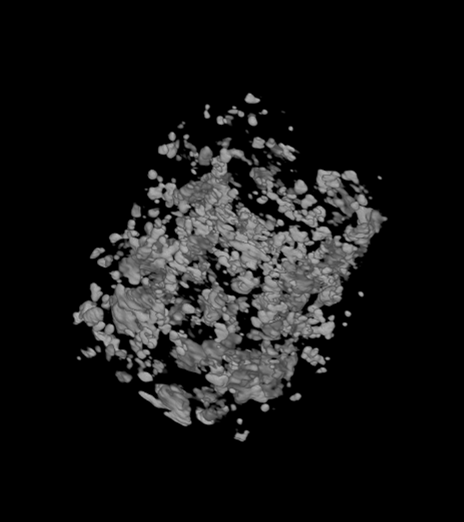
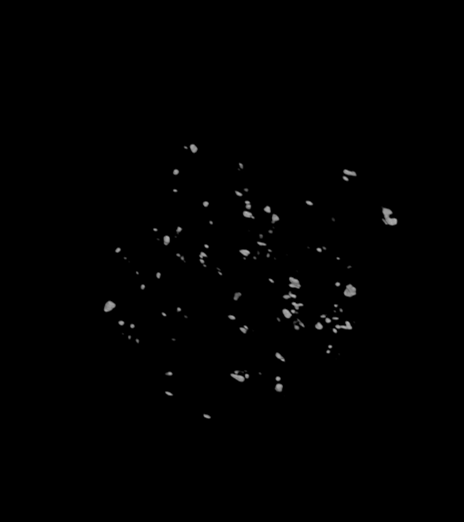
From left to right: overall minerals, olivine distribution, and magnetite distribution
From top to bottom: overall minerals, olivine distribution, and magnetite distribution
In addition to locating specific minerals, subsequent calculations and corrections can determine the content and grain size of each mineral, allowing for adjustments to the parameters of the included minerals. This process significantly reduces preparation and sampling time, increases the number of samples, and avoids the impact of stereological errors. It not only enhances laboratory analysis methods and accuracy but also integrates real-time analysis into the production line, enabling rapid adjustments to production line parameters and formulation ratios. This increases productivity, reduces energy consumption, and benefits continuous mineral processing and metallurgical engineering operations.